A Global Map of Human Impacts to Marine Ecosystems
An NCEAS working group published the first global assessment of cumulative human impacts on the ocean in Science on February 15, 2008. The findings, related maps, and openly available data became one of our most highly cited research efforts. The assessment showed where cumulative impacts were greatest and least and which human activities were driving these results.
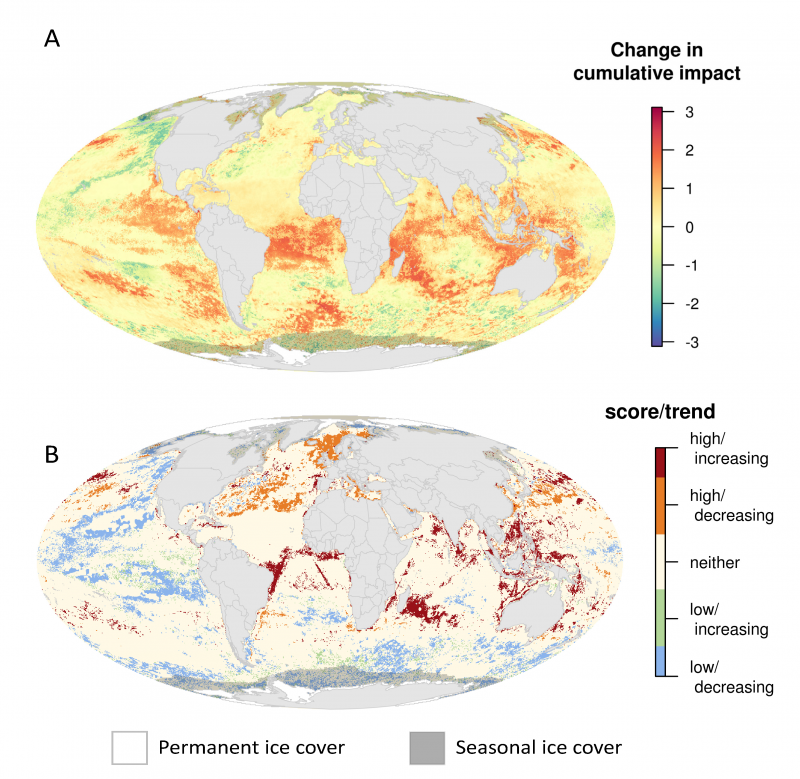
In 2015, a team made up of many of the same original participants conducted an updated assessment to show how and why cumulative impacts change over time, and specifically since the original 2008 assessment. Their results were published July 14, 2015 inNature Communications.
The results are intended to help assess the effectiveness of past management and conservation actions and guide future management efforts.
Using the Data
All of our data, figures and code are freely available for all not-for-profit uses. If you use our data and code, we ask that you attribute the source of these items according to citations indicated below.
Citing the Data: Please use the official DOI, available with each data set, and reference the paper in Nature Communications.
Citing the Figures: Cite the paper in Nature Communications or provide the attribution ‘B. Halpern and colleagues, National Center for Ecological Analysis and Synthesis.’